It’s that time of the month… for the real estate market update.
If there were 2 slides out of the 84 from this month’s KCM updates plus 1 from Altos, which ones would I share? … you will see the 3 below, plus a link to all the slides.
Do you want to attract more people to your brokerage, team, or office? Then help your team translate what all the information and data means and how to act on it. We can help, HMU.
Key updates for this month:
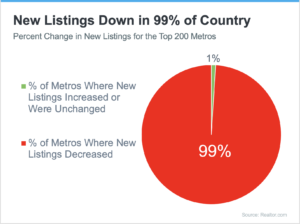
- 247 years later, Adam Smiths’ laws of supply and demand are still working: 99% of US markets had a DECREASE in available re-sale inventory for sale.
- Let’s look at 2 markets, for the past 7 and 90-day period
- You can type in your own market for real-time results
- A supply-constrained market with no relief in sight
- Large institutional investors have indicated no reason to sell – residential is providing higher ROI than commercial. Follow the money.
- Consumers are unwilling to trade a 3% mortgage for a 6%, opting instead to remodel or upgrade.
- New construction is growing – especially in the South – yet not nearly enough to close the gap.
- Freddie Mac survey: In the next 6 months = 18% of consumers indicated a desire to buy while 16% of sellers indicated a desire to sell.
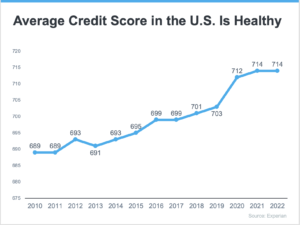
- While affordability is always an issue consumers have never been in better financial condition
- Average credit score the highest in 23 years – 714 Average
- For those applying for a mortgage: 765 is the median credit score
- Consumers have more access to data, and information YET lack knowledge
- YOU are the knowledge broker for local market activities
- AFTER speaking with a knowledgeable HYPER-LOCAL agent, 64.5% of homeowners were MORE likely to sell than before.
- Creating a conversation with value-added content makes a difference – NO SECRET AGENTS!
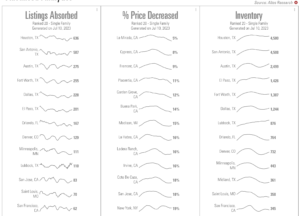
- A few of the top 20 markets with the most listings sold are in Texas: Houston; San Antonio; Austin, and DFW. Some of the tightest pricing is seen in CA, with less than 12% of listings (the national average is 32%) taking a price decline in cities like La Mirada; Cypress; Fremont; Placencia & Garden Grove.
Key takeaways:
- Enabling Homeowners and Investors with value-added information does create listing opportunities. Especially non-owner-occupied and 1031 exchange opportunities.
- 16% of homeowners indicated a desire to sell in the next 6 months… that is your opportunity
- Sales and Rates Normalizing – housing prices continue to show stronger growth than what was previously expected.
- Homebuilders continue to add to supply, but years of meager homebuilding over the past business cycle means the imbalance will likely continue for some time.
- Seasonality has returned
- Prices rebounding
Confidence is contagious, and so is a lack of confidence. There is plenty of actionable data to be confident about.
PS: Recruiting and retention has never been more important. In all types of markets, we continue to see 10% of agents leave the industry; 10 %to 15% join the industry, and despite an 85% satisfaction rate with their broker 32% switch firms. Need some help? Let’s chat.
—